Digital Mapping data serves as a basis for accurate prediction of coverage and interference. Almost every wave propagation model requires at least a topographic map for the calculation of the respective results. Depending on the use case and on the frequencies under evaluation also more specific mapping types are required. For example, for low frequencies, conductivity maps are very helpful whereas in very high frequencies, rain maps are much more important.
LS telcom has the knowledge to support you in all questions with regards to the required data and can provide you with a suitable and cost-effective package for your use case. In the paragraphs below, you can find further information about the available packages and an example that shows why accurate digital mapping data is essential for the production of reliable results.
Our Mapping Data Packages
Learn more about the different options
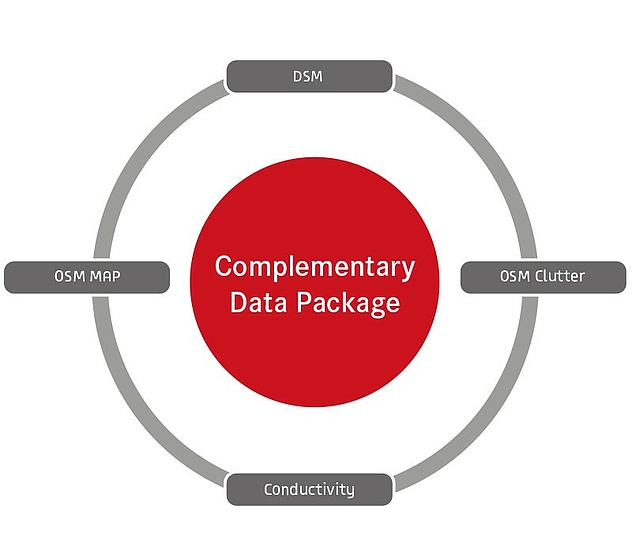
If budget is limited within a project, LS telcom can provide you with a basic package of digital mapping data free of charge. This package covers the complete area of interest (country or region) and has a resolution of 50m per pixel. It contains the following elements:
- Digital Surface Model (DSM)
- Clutter/Landusage Model
- Backdrop Map
- Conductivity Map
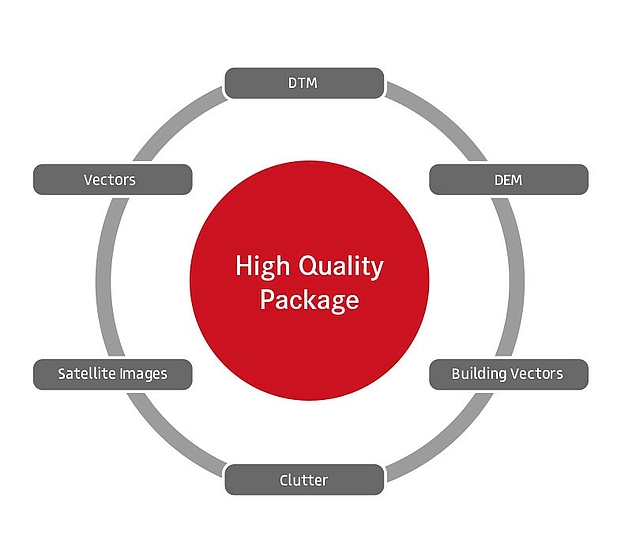
In the course of a project, LS telcom analyses your requirements and recommends a suitable package of digital mapping data for the respective requirements. Therefore, the contents of the package may vary as not every kind of map is required for each use case. Based in this information the package may include the following elements:
- Digital Terrain Model (DTM)
- Digital Elevation Model (DEM)
- Building Vectors
- Clutter/Landusage Model
- Satellite Image
- Additional Vectors (Roads, Railways, Places, etc.)
Why spend money on mapping data, when free data is available?
Our example shows the difference between calculations, which were performed with freely available open source data and with commercially available quality data. In the upper right-hand-side screenshot, you can see a clutter map of the free package. This map is based on openstreetmap data and relies on the quality of this free web data. On the lower righthand-side, you can see a clutter map, which was generated based on a precise satellite image and which is included in the high quality data package.
In order to test the quality of the data, LS telcom has performed a drive test, which is shown as a black line on the respective maps, and correlation calculations. The graphs below the maps show the difference (in green) between predicted (in blue) and measured (in red) field strength.
The outcomes show clearly that there are only minimal differences between predicted and measured results when the high quality data package is used, whereas one can observe substantial differences when calculations are based on the free data package.
The example illustrates that the quality of digital mapping data has a huge impact on calculation results, no matter which software tool is used for the respective calculations.


